
gdb(GNU debugger)를 설치해보자.
환경 구성
VMware 우분투 환경 구성은 아래 글을 참고하자.
2023.05.08 - [Tools] - VMware 가상머신 및 리눅스 우분투(Ubuntu) 설치 방법
pwndbg 설치
드림핵에서는 pwndbg를 기준으로 설명하니 이것을 설치하라고 하며, 다음 링크에서 다운할 수 있다.
https://github.com/pwndbg/pwndbg
GitHub - pwndbg/pwndbg: Exploit Development and Reverse Engineering with GDB Made Easy
Exploit Development and Reverse Engineering with GDB Made Easy - GitHub - pwndbg/pwndbg: Exploit Development and Reverse Engineering with GDB Made Easy
github.com
먼저 pwndbg 설치에 앞서 git을 설치하겠다.
먼저 터널에서 다음 명령을 입력해준다.
$ sudo apt update
$ sudo apt upgrade
그 다음 GIt을 설치해주겠다.
아래 코드를 입력하면 설치할 수 있다.
$ sudo apt install git-all
이제 설치해보겠다.
다음 명령어를 입력해보자.
git clone https://github.com/pwndbg/pwndbg
cd pwndbg
./setup.sh설치가 완료됐다.
dbg 실행
설치가 완료된 후, gdb를 입력하면 실행이 완료된다.

이제 quit으로 나가주고, 홈 디렉터리로 이동하겠다.
cd ~/
다음 코드를 분석해보겠다.
#include <stdio.h>

int main(void) {

  int sum = 0;

  int val1 = 1;

  int val2 = 2;

  sum = val1 + val2;

  printf("1 + 2 = %d\n", sum);

  return 0;

}
우선 vi 편집기로 위 코드 파일을 만들어주겠다. 파일명은 debugee.c이다.
vi debugee.c
그 다음에는 쉘에서 다음과 같은 명령을 입력한다. gcc 컴파일 명령어다.
gcc -o debugee debugee.c
이제 dbg를 실행해보겠다. 실행을 위해서는 다음과 같은 명령을 입력해준다.
gdb debugee이제 pwndbg에서 분석할 수 있다.
리눅스는 실행파일의 형식으로 ELF(Executable and Linkable Format)를 규정하고 있으며, 크게 헤더와 섹션으로 구성되어 있다. 헤더에는 실행에 필요한 정보가, 섹션에는 컴파일된 기계어 코드나 프로그램 문자열 등 여러 데이터가 포함되어 있다.
EFL의 헤더 중에 진입점(Entry Point, EP)라는 필드가 있는데 운영체제는 ELF를 실행할 때 진입점의 값부터 프로그램을 실행한다. readelf로 확인해보겠다.
movefun@movefun-virtual-machine:~$ readelf -h debugee
ELF Header:
  Magic:   7f 45 4c 46 02 01 01 00 00 00 00 00 00 00 00 00
  Class:                             ELF64
  Data:                              2's complement, little endian
  Version:                           1 (current)
  OS/ABI:                            UNIX - System V
  ABI Version:                       0
  Type:                              DYN (Shared object file)
  Machine:                           Advanced Micro Devices X86-64
  Version:                           0x1
  Entry point address:               0x540
  Start of program headers:          64 (bytes into file)
  Start of section headers:          8640 (bytes into file)
  Flags:                             0x0
  Size of this header:               64 (bytes)
  Size of program headers:           56 (bytes)
  Number of program headers:         9
  Size of section headers:           64 (bytes)
  Number of section headers:         34
Section header string table index: 33그 결과 debugee의 진입점(Entry point)는 0x540이다.
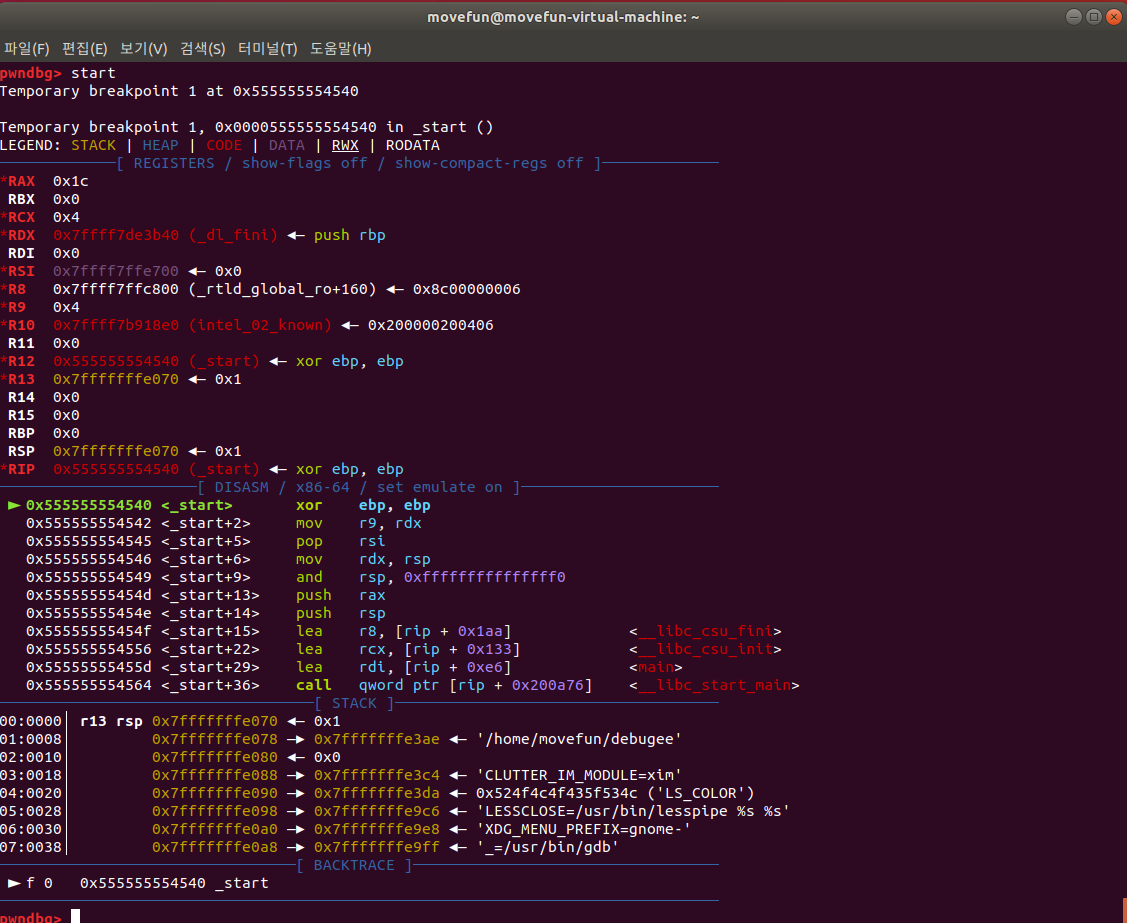
start 명령을 입력하니 다음과 같은 화면이 등장했다. 여기서 gdb 명령을 활용해 사용하면 된다.